2025年2月26日 星期三

一句 SQL 不使用 Index 之案例分析

問題描述:

一句 SQL 語法的執行計畫不使用 Index 造成效能不佳 :

SELECT T.* FROM T01_URL T WHERE T.URL LIKE :B1 AND TYPE = 'U'

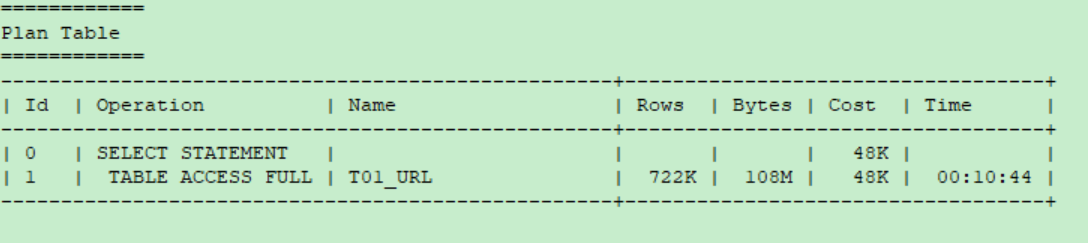
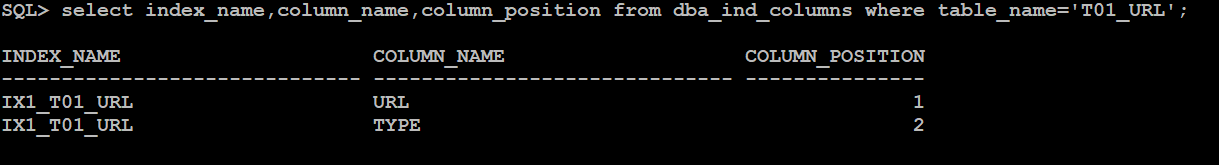
此 table 具有 Index IX1_T01_URL 但是 execution plan 卻沒有使用 :


問題分析:

收集 10053 trace 分析為何沒有使用 Index :

SQL> exec dbms_sqldiag.dump_trace(p_sql_id=>'847df3vkcbsvh',p_child_number=>0,

p_component=>'Compiler');


依據 10053 的內容來計算 cost ,公式如下 :

Cost = IO Cost + CPU Cost

  • IO Cost = SRs + (MRs * (MREADTIM / SREADTIM))

  • CPU Cost = CYCLES / (CPUSPEED * 1000 * SREADTIM)

  • SREADTIM = IOSEEKTIM + (DB_BLOCK_SIZE / IOTFRSPEED)

  • MREADTIM = IOSEEKTIM + (DB_FILE_MULTIBLOCK_READ_COUNT * DB_BLOCK_SIZE) / IOTFRSPEED

Full Table Scan

  • SRs = 0

  • MRs = BLOCKS / MBRC

Index Range Scan

  • MRs = 0

  • SRs = LEVELS + (LBs * IX_SEL) + (CLUF * IX_SEL_WF)


其中 :

CPU Cycles : 指執行一條指令所花費的時間, 單位為 納秒  1/1,000,000,000 秒

SRs = Single-block reads.

MRs = Multi-block reads.

sreadm = single block read time.

mreadtim = multi block read time.

LBs = Index Leaf Blocks.

IX_SEL = Index Selectivity.

IX_SEL_WF = Index Selectivity with Filters.


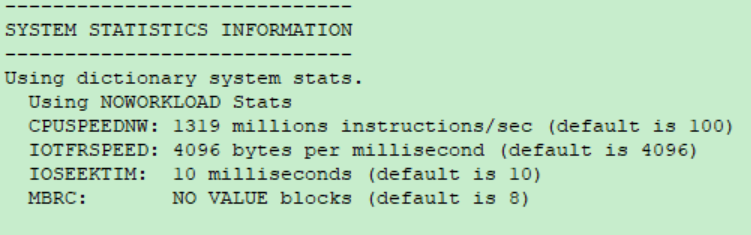
由 10053 所收集到的系統統計資訊可得到的數據如下 :

使用 Full Table Scan 的 Cost 約為 48657 :


套入公式計算如下 :

IO Cost = 48319

SREADTIM = IOSEEKTIM + (DB_BLOCK_SIZE / IOTFRSPEED) = 10 + (8192/4096) = 12

CPU Cost = CYCLES / (CPUSPEED * 1000 * SREADTIM) = 5351367865.712324 / (1319*1000*12) = 338.095013

Total Cost = IO Cost + CPU Cost = 48319 + 338.095013 = 48657.095


使用 Index Range Scan 的 Cost 約為 770733 :


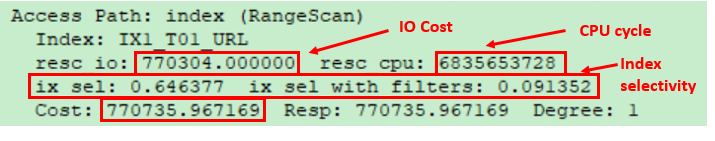
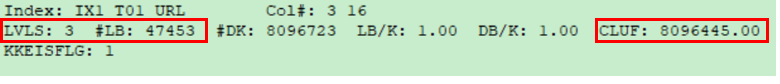
其中 Index 所收集的統計資訊如下 :


套入公式計算如下 :

IO Cost = SRs + (MRs * (MREADTIM / SREADTIM)) = SRs = LEVELS + (LBs * IX_SEL) + (CLUF * IX_SEL_WF) = 3 + (47453 * 0.646377) + (8096445 * 0.091352) = 770301.971

CPU Cost = CYCLES / (CPUSPEED * 1000 * SREADTIM) = 6835653728 / (1319*1000*12) = 431.870971

Total Cost = IO Cost + CPU Cost = 770301.971 + 431.870971 = 770733.842


雖然手工計算出來的最終 cost 有一點誤差,但不影響我們分析。以結論來說,使用 Table Scan 的 cost 48657 小於使用 Index Range Scan 的 cost 770733 ,所以優化器最終使用的是 Table Scan。


進一步分析,針對 CPU Cost 來說, Table Scan 為 338 、 Index Range Scan 為 431 ,兩者其實差不多,但是 Index Range Scan 的 IO Cost 770733 卻遠遠大於 Table Scan 的 IO Cost 48319 ,這最終導致優化器認為使用 Index Range Scan 的成本太高而不選擇它。


由公式推斷,影響 Index Range Scan 的 IO Cost 最重要的因素為 IX_SEL 與 IX_SEL_WF ,也就是使用此 Index 的選擇性,這兩個因素的數值過大導致最終計算出來的 IO Cost 過大,所以從這邊可以知道,此 Index IX1_T01_URL(URL,TYPE) 的選擇性不佳,在這兩個欄位建立 Index 對於優化器來說是不適合的,必須尋求是否有更適合的欄位或是調整欄位的順序來建立 Index 。


結論:

Oracle CBO 會選擇 Cost 最低的路徑來做為最後執行的 Execution Plan ,由上述 10053 分析結果得知 IX1_T01_URL(URL,TYPE) 的選擇性不佳,但是由 SQL 語句來看,就只有 URL 、 TYPE 兩個 where 條件,理論上建立這個 Index 是合適的,那麼這邊就與優化器的判斷產生了矛盾。


以這個例子來說,使用 Index 應該是較好的選擇,但優化器因為數據公式化的關係無法做此判斷,所以本次我們應該使用 Hint ,或是建立 SQL Profile 來輔助優化器來使用 Index 。

ORA-4031 案例分析

Oracle 版本: 19.11

OS 版本: Linux 7.6


問題描述:

Oracle Client 無法連線至資料庫,查看 alert log 發現大量的 ORA-04031 錯誤訊息 :

2024-12-28T23:50:38.542646+08:00

Errors in file /orcl_db01/ora19/app/oracle/diag/rdbms/orcl/ORCL/trace/ORCL_ora_2984784.trc  (incident=220937):

ORA-04031: unable to allocate 4096 bytes of shared memory ("shared pool","EBS_STATUS_HIST","PRTMV^8cd4d535","kkpomSort hashed kpn's")

Use ADRCI or Support Workbench to package the incident.

See Note 411.1 at My Oracle Support for error and packaging details.

2024-12-28T23:50:46.173456+08:00

Errors in file /orcl_db01/ora19/app/oracle/diag/rdbms/orcl/ORCL/trace/ORCL_ora_2986554.trc  (incident=222098):

ORA-04031: unable to allocate 4096 bytes of shared memory ("shared pool","EBS_STATUS_HIST","PRTMV^8cd4d535","kkpomSort hashed kpn's")

Use ADRCI or Support Workbench to package the incident.

See Note 411.1 at My Oracle Support for error and packaging details.

2024-12-28T23:51:16.716651+08:00

Errors in file /orcl_db01/ora19/app/oracle/diag/rdbms/orcl/ORCL/trace/ORCL_ora_2987366.trc  (incident=222809):

ORA-04031: unable to allocate 4096 bytes of shared memory ("shared pool","IX_EBS_1","pacdHds_kkpaco","kksgaAlloc: firstN")


問題分析:

ORA-04031 錯誤表示因為 shared pool 空間不足所致,必須要分析 shared pool 當中的哪個成分所造成空間不足,在發生問題的當下可以透過查詢 v$sgastat 來分析哪個成分占用較多空間 :

SQL> SELECT name, bytes FROM v$sgastat WHERE pool = 'shared pool'

   ORDER BY bytes DESC;


或者是從 incident trace 所收集的 heap dump 來分析,從 TOP 20 MAXIMUM MEMORY USES ACROSS SGA HEAP 可以發現當前占用 shared pool 最多的是 "pga accounting" :


"pga accounting" 這個成分是用來存放 process state object 所用,當一個連線成立之後,在建立 server process 之前會先檢查當前 process 數量是否還沒有達到 process 參數所設定的上限,如果還足夠的話,則會申請一個 process 位址來建立此 server process ,由 v$process 的 ADDR 欄位就可以查到此位址。當 server process 成立之後便會分配 56 bytes 的空間來存放 process state object ,也就是從 shared pool 當中所看到的 "pga accounting" 。


在 19.11 這個版本有 Bug 33415279 ,此 Bug 讓 56 bytes 的空間沒有隨著 server process 結束來回收或重複使用,當新的 server process 建立時又重新產生一個 56 bytes 的 "pga accounting" ,漸漸的就把 shared pool 用完,然後就產生了 ORA-04031 的錯誤。


解決方法:

Bug 33415279 於 19.14 版本以上修復,將資料庫 patch 到 19.14 以上的版本,或者是在 19.11 直接 apply 33415279 的 one-off patch 皆可。在問題發生的當下,加大 shared_pool_size 或者是 flush shared_pool 可以短暫的解決問題,但最終還是需要打 patch 才能根本解決。